The Solar Panel Payback Period: Factors That Impact Your ROI

Homeowners considering solar often ask one practical question first: How long until this system pays for itself? That question is answered by the solar panel payback period—the number of years it takes for energy savings, incentives, and avoided utility costs to equal the net amount you invested. Once that threshold is crossed, every additional kilowatt-hour the system produces is essentially profit in the form of lower bills and greater energy independence.
Call Now to See Your Solar Payback Timeline
The payback period is not a mystery or a marketing slogan. It is a straightforward financial concept driven by a handful of measurable variables. Understand those variables and you can estimate your own return on investment (ROI) with far more confidence. This article explains the concept clearly, walks through the five factors that most strongly influence payback—system cost, incentives, electricity rates, sun hours, and household energy consumption—and provides realistic examples so you can see how the numbers typically behave.
A well-designed solar installation is not a gamble. It is an asset whose performance can be modeled, monitored, and improved. The goal is not the shortest possible payback at any cost; it is a balanced, durable return that matches your roof, your usage, and your local market.
What the Payback Period Actually Measures
The simple payback period is calculated as:
Net System Cost ÷ Annual Net Savings = Years to Payback
- Net System Cost is the installed price after rebates, tax credits, and other incentives.
- Annual Net Savings is the dollar value of electricity you no longer buy from the utility, plus any extra compensation from net metering or solar renewable energy certificates, minus modest operating costs such as monitoring or occasional cleaning.
A more complete view also considers cash-flow timing, the time value of money, and rising utility rates. For most residential decisions, the simple payback remains the most useful starting point because it is easy to understand and easy to compare across quotes.
Typical residential payback in many U.S. markets falls in the 6- to 12-year range. Systems that land toward the shorter end of that range usually combine a competitive installed price, strong incentives, high local electricity rates, good sun exposure, and a household that uses most of the power it generates. Systems that take longer often face one or more headwinds: higher equipment or labor costs, weaker incentives, cheap grid power, shading, or a mismatch between production and consumption.
The remainder of this article examines each major driver in turn.
System Cost: The Starting Point of Every Calculation
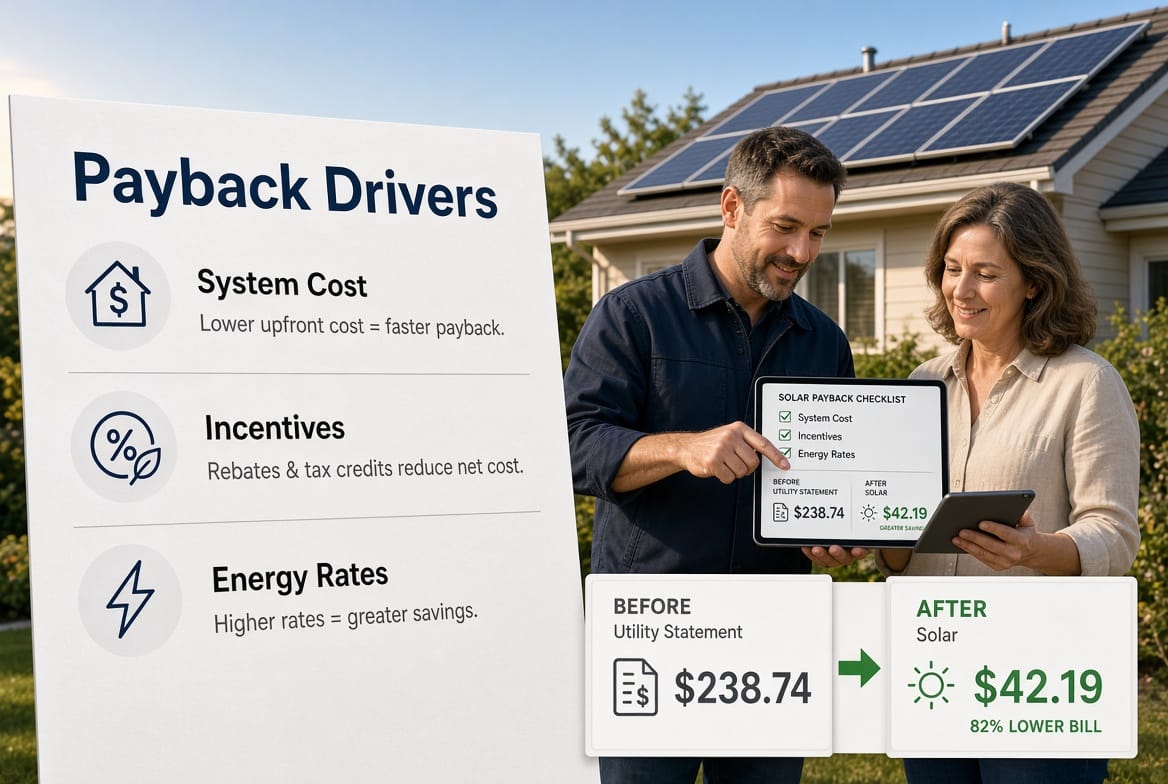
System cost is the largest single number in the equation. It includes panels, inverters, racking, electrical work, permits, and labor. Because payback is net cost divided by annual savings, a lower net cost shortens the timeline immediately.
Installed prices vary by region, roof complexity, equipment tier, and installer efficiency. A straightforward, unshaded south-facing roof on a single-story home generally costs less per watt than a multi-plane, steep, or tile roof that requires extra engineering and labor. Premium panels and microinverters raise the upfront price but can improve production and monitoring, which may improve annual savings enough to offset part of the extra cost.
Example:
A 8 kW system quoted at $2.80 per watt costs $22,400 before incentives. After a 30 percent federal credit and a modest state rebate, the net cost drops to roughly $14,500. If that system saves $1,900 per year, simple payback is about 7.6 years. The same physical system quoted at $3.40 per watt would start at $27,200, net closer to $17,800 after the same incentives, and take roughly 9.4 years to pay back—same roof, same sun, different price.
Shopping on price alone is risky. The lowest bid can hide thinner warranties, weaker production estimates, or installers who disappear after commissioning. The professional approach is to compare net cost per expected annual kilowatt-hour, not just the headline dollar amount.
Ways to manage system cost without sacrificing quality include:
- Obtaining multiple detailed quotes that use the same production assumptions
- Choosing a system size that matches actual usage rather than oversizing “just in case”
- Asking about installer volume discounts or current manufacturer promotions
- Confirming that the quote includes all required electrical upgrades so no surprise costs appear later
A competitive but complete price is the foundation of a healthy ROI.
Incentives: The Fastest Way to Reduce Net Cost
Incentives directly shrink the numerator of the payback formula. The most widely available federal incentive has been the Investment Tax Credit, which allows eligible owners to claim a percentage of qualified system costs against federal tax liability. State rebates, performance-based incentives, sales-tax exemptions, and property-tax exclusions can add further reductions.
Because incentives are time-limited or subject to legislative change, timing matters. A homeowner who installs while a strong credit is still available locks in a lower net cost than a neighbor who waits until the credit steps down.
Example:
Using the 8 kW system above, a 30 percent federal credit reduces a $22,400 system by $6,720. A $1,000 state rebate brings net cost to $14,680. Without those two incentives the same system would need nearly 12 years of $1,900 annual savings to break even. With them, payback drops below eight years. That is the power of incentives: they do not change how much electricity the panels produce; they change how much you had to pay to own that production.
Other incentive structures work differently:
- Performance-based payments reward actual kilowatt-hours generated
- Net-metering credits increase the value of each kilowatt-hour rather than reducing upfront cost
- Low-interest solar loans or Property Assessed Clean Energy programs change cash-flow timing even if they do not change the simple payback number
The authoritative approach is to model your eligibility, your tax situation, and your local programs rather than relying on national averages. A custom analysis removes guesswork.

Electricity Rates: The Value of Every Kilowatt-Hour You Avoid Buying
Electricity rates determine how much each avoided kilowatt-hour is worth. A household paying 18 cents per kWh saves more per unit of solar production than a household paying 11 cents. Rising rates improve payback over time; falling or flat rates slow it.
Rate design also matters. Time-of-use plans that charge more in late afternoon can increase the value of solar if the system is producing during those expensive hours. Demand charges or minimum bills can reduce net savings if they are not modeled correctly. Net-metering rules decide whether surplus production is credited at full retail rate, a lower avoided-cost rate, or something in between.
Example:
The same 8 kW system produces 11,200 kWh per year. At 12 cents per kWh the annual savings are about $1,344 and payback (after incentives) stretches past 10 years. At 20 cents per kWh the same production is worth $2,240 per year and payback falls under 7 years. Utility rate trajectory is therefore one of the most important assumptions in any long-term ROI model.
Homeowners in high-rate territories often see the strongest financial case. Homeowners in low-rate territories can still benefit, but they usually need lower net system costs or stronger incentives to reach an attractive payback.
Sun Hours and Site Quality: How Much Energy the System Actually Makes
Peak sun hours (the equivalent number of hours per day that sunlight intensity averages 1,000 watts per square meter) set the production potential of any given array. A system in the desert Southwest will generate more annual kilowatt-hours than an identical system in a cloudier northern climate, all else equal.
Site-specific factors modify that potential:
- Roof orientation and tilt
- Shading from trees, chimneys, or neighboring buildings
- Local temperature (panels lose a little efficiency in extreme heat)
- Soiling from dust, pollen, or snow
A professional production estimate uses satellite imagery, shade reports, and local weather data rather than a generic “average.” Overstating sun hours is one of the most common ways a quote can look better on paper than it performs on the roof.
Example:
An 8 kW system in a location with 5.2 peak sun hours and good orientation might produce 12,000 kWh per year. The same system in a location with 3.8 peak sun hours and partial afternoon shade might produce only 8,400 kWh. If electricity is worth 16 cents per kWh, the first system saves $1,920 annually and the second saves $1,344. That difference alone can add two or more years to payback.
Mitigation is possible: microinverters or power optimizers reduce the impact of partial shade; a slightly larger array can compensate for modestly lower sun hours; tree trimming can restore production. The key is an honest site assessment before contracts are signed.
Household Energy Consumption: Matching Production to Real Use
Energy consumption determines how much of the system’s output you can use on-site and how much is exported. High self-consumption generally improves economics under most net-metering rules because every kilowatt-hour used at home displaces a full retail-rate purchase.
A household that uses 14,000 kWh per year can productively host a larger system than a household that uses 7,000 kWh. Oversizing beyond what the home and the interconnection rules can absorb often yields diminishing returns.
Example:
Family A uses 13,500 kWh annually and installs an 8 kW system that produces 11,000 kWh. Almost all production offsets their own usage; annual savings are high and payback is attractive. Family B uses only 6,800 kWh and installs the same 8 kW system. A large share of production is exported at a lower credit rate, so annual dollar savings are smaller and payback lengthens unless the utility offers full retail net metering.
Practical steps that improve the consumption side of the equation include:
- Completing basic efficiency upgrades (LED lighting, smart thermostat, efficient HVAC) before finalizing system size
- Shifting flexible loads (EV charging, laundry, pool pump) into solar production hours
- Considering battery storage only when the extra cost is justified by backup needs or time-of-use savings—not automatically
Consumption is the factor you control most directly after the system is installed.
Putting the Factors Together: Two Realistic Scenarios
Scenario 1 — Favorable conditions
Net system cost after incentives: $13,800
Annual production: 11,400 kWh
Blended value of energy: $0.19/kWh
Annual savings: $2,166
Simple payback: 6.4 years
This home has a competitive installed price, strong incentives, high local rates, excellent sun, and usage that absorbs most of the production.
Scenario 2 — Mixed conditions
Net system cost after incentives: $18,200
Annual production: 9,100 kWh
Blended value of energy: $0.13/kWh
Annual savings: $1,183
Simple payback: 15.4 years
This home faces higher net cost, weaker production, and lower rates. The system may still be worthwhile for resilience or environmental reasons, but the financial payback is slower. A smaller system or additional incentives would change the picture.
These examples illustrate why generic “solar pays for itself in X years” claims are incomplete. Your roof, your bills, and your local rules produce your number.
Improving Your Own Payback Outlook
You cannot change the sun, but you can influence every other variable:
- Obtain apples-to-apples quotes that disclose production estimates and assumptions
- Confirm current federal, state, and utility incentives before signing
- Right-size the system to actual and near-term consumption
- Address shading and orientation during design, not after installation
- Monitor performance after commissioning so any underperformance is corrected quickly
A professional installer will run a site-specific model rather than handing you a national average. That model should be transparent enough that you can see how each factor moves the payback date.
Conclusion: Clarity Beats Guesswork
The solar panel payback period is simply the time required for accumulated savings to equal your net investment. System cost sets the starting line. Incentives pull that line closer. Electricity rates set the value of each kilowatt-hour. Sun hours and site quality determine how many kilowatt-hours you actually receive. Household energy consumption determines how much of that production you can use at the highest value.
None of these factors is unknowable. When they are measured honestly and modeled together, the resulting ROI picture is both reassuring and actionable. Solar is a long-lived asset; a clear-eyed payback analysis is the professional way to decide whether—and how large—a system belongs on your roof.
Understand your solar ROI. A site-specific review will replace averages with your numbers and show exactly which factors will shape your payback timeline.
See How Fast Solar Can Pay for Itself – Call Now!