The Solar Panel Payback: Calculating Your ROI

Investing in solar energy represents one of the most practical financial decisions a homeowner or business can make today. Understanding the solar panel payback period allows you to measure exactly when your system begins generating pure profit. This comprehensive guide walks through a clear financial analysis so you can calculate your return on investment (ROI) with confidence. By the end, you will know the precise formula, see real-world examples across different system sizes and utility rates, and recognize every major factor that influences how quickly your panels pay for themselves.
Get Your Free Solar Payback Analysis – Call Now!
Understanding the Core Financial Analysis
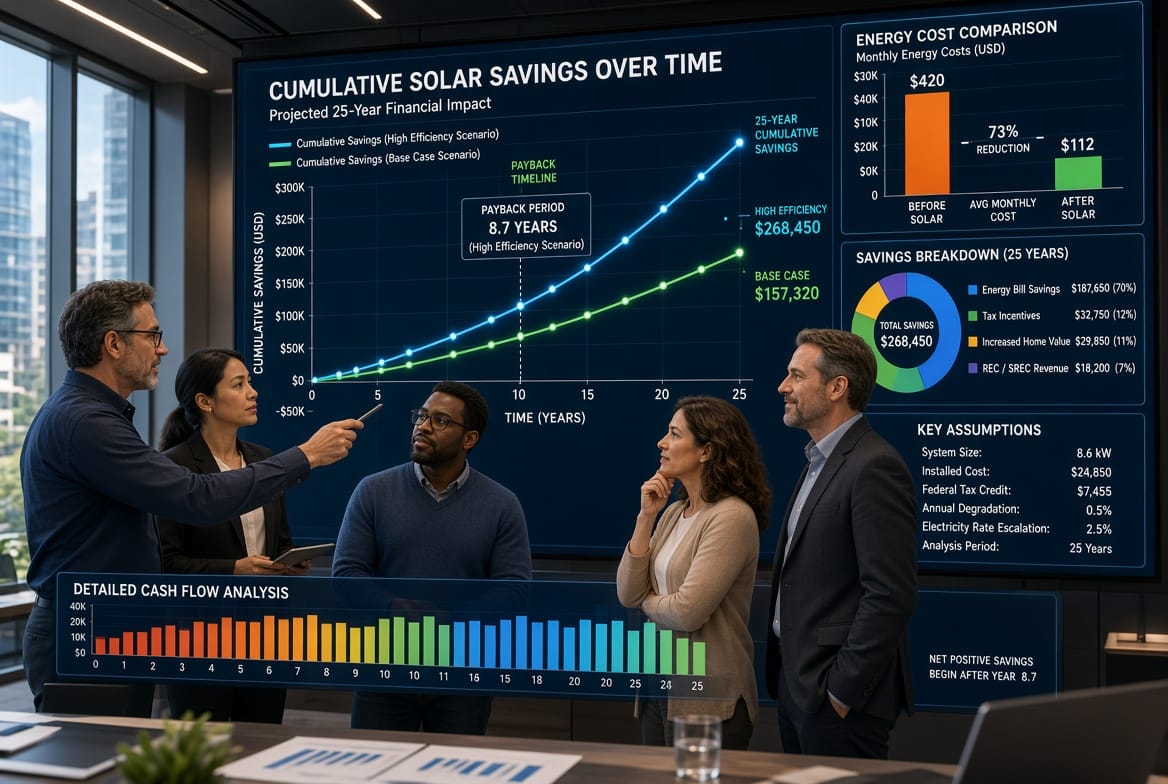
A solid financial analysis begins with one straightforward question: How long will it take for the money you save on electricity to equal the money you spent on the solar system? The answer is the payback period. Once that period ends, every kilowatt-hour your panels produce becomes pure savings or income.
The analysis rests on three primary numbers:
- The net system cost after all incentives
- The annual electricity savings the system delivers
- The expected lifespan of the panels (typically 25–30 years)
When these figures are combined correctly, the payback period reveals the true speed of your ROI. A shorter payback means faster financial freedom from rising utility rates. A longer payback still delivers strong long-term value, but the timeline simply stretches.
How to Calculate the Payback Period Step by Step
The industry-standard formula is elegantly simple:
Payback Period (years) = Net System Cost ÷ Annual Savings
Where:
- Net System Cost = Total installed price minus all available incentives
- Annual Savings = Yearly electricity production × your utility rate (or avoided cost)
Let us break this down into actionable steps so you can perform the calculation yourself.
- Obtain a firm quote for the complete installed system, including panels, inverters, mounting hardware, permits, and labor.
- Subtract every applicable incentive—federal tax credit, state rebates, local utility programs, and performance-based incentives.
- Estimate annual energy production using your location’s average sun hours and the system’s rated capacity.
- Multiply that production by your current utility rate (or projected future rate) to find annual savings.
- Divide the net cost by the annual savings. The result is your payback period in years.
This calculation assumes the system performs at rated output and that utility rates remain stable or rise modestly. In reality, most homeowners experience even faster payback because electricity prices continue to climb.
Practical Examples Across System Sizes and Utility Rates
Numbers bring the formula to life. Below are three realistic scenarios using average 2026 installed costs of approximately $2.80 per watt before incentives and a federal tax credit of 30 percent. Production estimates assume moderate sun exposure of 4.5 peak sun hours per day.
Example 1: Compact 5 kW Residential System
- Gross installed cost: $14,000
- Federal tax credit (30 %): –$4,200
- Net System Cost: $9,800
- Annual production: approximately 7,300 kWh
- At a utility rate of $0.12 per kWh → Annual Savings = $876
- Payback Period = 9,800 ÷ 876 ≈ 11.2 years
At a higher utility rate of $0.18 per kWh the same system delivers $1,314 in annual savings and a payback period of only 7.5 years.
Example 2: Popular 8 kW Family Home System
- Gross installed cost: $22,400
- Federal tax credit: –$6,720
- Net System Cost: $15,680
- Annual production: approximately 11,700 kWh
- At $0.12 per kWh → Annual Savings = $1,404
- Payback Period = 15,680 ÷ 1,404 ≈ 11.2 years
Raise the rate to $0.20 per kWh and annual savings climb to $2,340, shrinking the payback period to 6.7 years. Many households in high-rate states achieve payback in under seven years with this size system.
Example 3: Robust 12 kW System for Larger Homes or Light Commercial
- Gross installed cost: $33,600
- Federal tax credit: –$10,080
- Net System Cost: $23,520
- Annual production: approximately 17,500 kWh
- At $0.15 per kWh → Annual Savings = $2,625
- Payback Period = 23,520 ÷ 2,625 ≈ 9.0 years
In regions charging $0.25 per kWh the same system yields $4,375 yearly and reaches payback in just 5.4 years. After that point the owner enjoys more than two decades of essentially free electricity.
These examples illustrate a powerful truth: higher utility rates and larger systems that capture more sunlight dramatically accelerate ROI. Even the longest payback still leaves 15–20 years of pure savings once the system is paid off.
Critical Factors That Influence Your Solar Payback Timeline
Several variables can shorten or lengthen the payback period. Understanding each one allows you to optimize your investment.
Available Sun Hours
Geographic location determines how many peak sun hours your panels receive daily. Southern states often enjoy 5–6 hours, while northern regions may average 3.5–4.5. More sun hours mean higher annual production and faster payback. A system in Arizona can reach payback two to three years sooner than an identical system in the Pacific Northwest purely because of superior sunlight.
Incentives and Rebates
The federal Investment Tax Credit currently stands at 30 percent and remains a cornerstone of rapid ROI. Additional state tax credits, utility rebates, and net-metering credits further reduce the net cost. In states with strong incentive programs the payback period can drop below five years. Always verify current local programs because they change periodically and can dramatically improve your numbers.
Utility Energy Rates and Escalation
The higher your current electricity rate, the greater your annual savings. Equally important is the expected rate of increase. Historically, utility rates rise 2–4 percent annually. When you factor in this escalation, the payback period calculated with today’s rate actually shortens in real-world terms because future savings grow larger each year.
System Cost and Quality
Panel efficiency, inverter type, and installation quality affect both upfront price and long-term production. Premium equipment may cost slightly more yet generate more electricity over decades, improving overall ROI. Shopping for competitive quotes while prioritizing reputable installers protects both performance and warranty coverage.
Energy Consumption Patterns
Homes that use more electricity during daylight hours capture greater self-consumption value. Adding battery storage can further increase savings by shifting excess solar energy into evening hours, though the added cost must be included in the net system figure.
Maintenance and Degradation
Modern solar panels degrade at roughly 0.5 percent per year. High-quality systems still produce 85–90 percent of original output after 25 years. Minimal maintenance—occasional cleaning and annual inspections—keeps production high and protects the calculated payback period.

Beyond Simple Payback: Additional Financial Benefits
While the payback period focuses on recovering the initial investment, true ROI extends further. After the system is paid off, you continue receiving free electricity for the remaining life of the panels. A typical 25-year warranty period after a 8-year payback yields 17 full years of pure savings—often totaling two to three times the original net cost.
Property value also rises. Independent studies consistently show that homes with owned solar systems sell faster and at higher prices. The increase frequently offsets a substantial portion of the original investment, effectively shortening the financial recovery timeline even more.
Some owners participate in community solar or virtual net metering programs that generate additional revenue streams. Others pair solar with time-of-use rate plans to maximize the value of every kilowatt-hour produced. Each of these strategies compounds the core payback period calculation into an even stronger overall return.
Common Pitfalls to Avoid When Estimating ROI
Accurate projections require realistic assumptions. Overestimating production or underestimating future maintenance can create overly optimistic numbers. Always request a production estimate based on local weather data rather than manufacturer ideal ratings. Confirm that the installer includes all soft costs—permits, interconnection fees, and structural upgrades—in the quoted price. Finally, model utility rate escalation at a conservative 2–3 percent so your payback period remains achievable even if rates rise more slowly than expected.
Taking Control of Your Energy Future
Calculating the solar panel payback period transforms an abstract environmental decision into a concrete financial plan. Whether your system recovers its cost in five years or twelve, the remaining decades of reduced or eliminated electricity bills deliver lasting security. Rising utility rates only improve the equation over time, making solar one of the few investments that becomes more valuable the longer you own it.
The formula is accessible, the examples are proven, and the factors are manageable. With a clear understanding of net cost, annual savings, sun hours, incentives, and energy rates, every homeowner can project a reliable ROI.
Calculate your solar ROI today. A personalized analysis accounts for your exact roof orientation, local utility rates, available incentives, and energy usage patterns.
Get a Personalized Solar Payback Calculation – Call Today!