The Solar Panel Inverter Monitoring: Reading Your System's Data
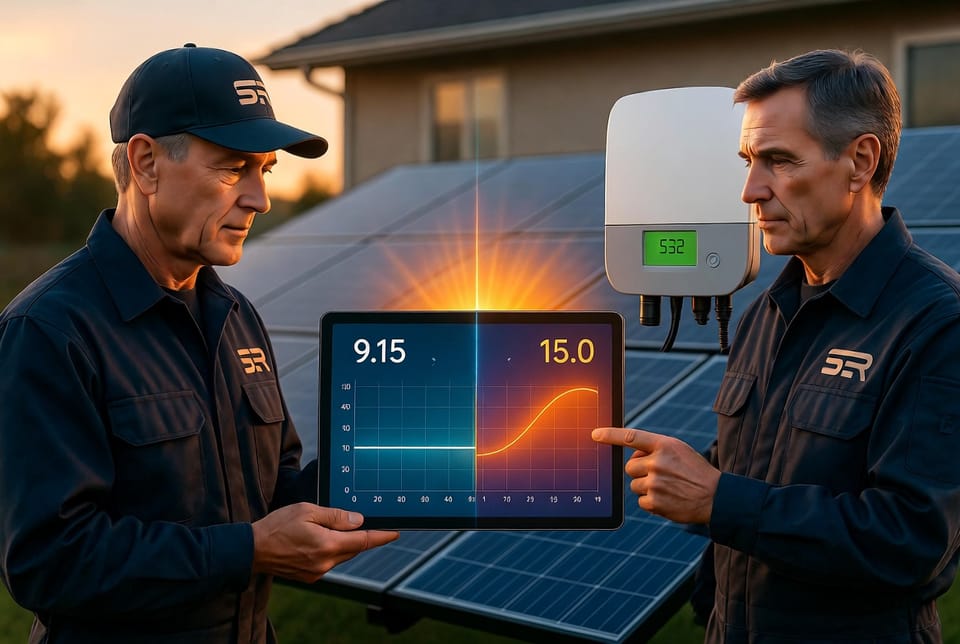
Your solar energy system is more than panels on a roof. At its heart sits the inverter, the device that converts the direct current your panels generate into usable alternating current for your home. Equally important is the data that inverter produces every minute of every day. Learning how to read that information transforms a set of numbers into a powerful tool for protecting your investment, maximizing savings, and catching small issues before they become costly problems.
Get Expert Help Reading Your Inverter Data – Call Now
This guide walks you through the essential metrics displayed by modern inverter monitoring systems—whether you check them on a wall-mounted screen, a dedicated portal, or a smartphone app. You will learn what each figure means, why it matters, and how to recognize the early signs of underperformance. The tone throughout is practical and reassuring: with a few minutes of regular attention you can keep your system running at its best for decades.
Why Inverter Monitoring Matters
A solar installation is designed to deliver reliable clean energy for twenty-five years or longer. Yet weather, debris, wiring connections, and component aging can slowly reduce output. Without monitoring, these declines often go unnoticed until the electric bill rises or a complete shutdown occurs.
Inverter monitoring closes that gap. It gives you continuous visibility into daily production, real-time power, cumulative energy, and any fault messages. Homeowners who check their data regularly report greater peace of mind and faster resolution of minor issues. The process is straightforward once you know the key numbers and patterns.
Accessing Your Inverter Data
Most contemporary systems offer three convenient ways to view information:
- A small display mounted on the inverter itself
- A manufacturer web portal accessed from any browser
- A free mobile app that pushes notifications
Whichever method you prefer, the core data points remain consistent. Log in or open the app and look for the dashboard that summarizes production. Spend a few minutes familiarizing yourself with the layout; the more comfortable you become, the faster you will spot anything unusual.
Daily Production (kWh): The Heartbeat of Your System
Daily production, measured in kilowatt-hours (kWh), tells you exactly how much energy your system generated from sunrise to sunset on a given day. This is the single most useful number for day-to-day awareness.
On a clear summer day a typical residential array might produce 30–50 kWh, depending on system size, orientation, and location. Cloudy or short winter days naturally yield less. The important habit is comparison: look at today’s figure next to yesterday’s and the same date last year if historical data is available.
A sudden drop of 30 percent or more on a sunny day is worth investigating. Possible causes include temporary shading from a new tree branch, soiling on the panels, or a string of modules that has temporarily gone offline. Because daily production is cumulative, even small consistent shortfalls add up over a month. Checking this metric every few days keeps you ahead of gradual losses.
Current Output: Instant Power Snapshot
While daily production looks backward, current output (often labeled “power” or “real-time power” and shown in watts or kilowatts) shows what the system is generating right now.
On a bright midday the number should approach the system’s rated capacity. Early morning or late afternoon the figure will be lower, which is normal. Zero output during daylight hours, however, is a red flag. It can indicate an inverter shutdown, a tripped breaker, or a communication glitch.
Glance at current output whenever you open the app. If the sun is shining and the number is unexpectedly low or zero, take a quick look at the inverter display for any status lights or error messages. Most modern inverters restart automatically after brief grid interruptions; persistent zero readings deserve a closer check.
Lifetime Production: The Long-Term Scorecard
Lifetime production is the total energy your system has delivered since the day it was commissioned. This cumulative figure grows steadily and serves as a reliable benchmark of overall health.
Compare the lifetime total against the system’s expected annual yield multiplied by years of service. If the actual number falls noticeably short of projections, further investigation is warranted. Lifetime data also helps quantify environmental impact—many portals convert kWh into equivalent trees planted or carbon dioxide avoided—reinforcing the value of your investment.
Because this metric never resets, it is especially useful when evaluating long-term performance or preparing documentation for warranties and incentives.
Error Codes and Status Messages: Your Early-Warning System
Inverters communicate problems through error codes or plain-language status messages. These range from simple notices such as “grid voltage high” to more specific alerts about ground faults, over-temperature, or communication loss.
Never ignore an active error. Most codes are temporary and clear themselves once conditions return to normal, yet some signal issues that require attention. Record the exact code or message, note the date and time, and check the manufacturer’s app or manual for the recommended response. In many cases a simple power-cycle of the inverter or a visual inspection of wiring and breakers resolves the matter. Persistent or recurring codes are best reviewed by a qualified technician.
Modern monitoring platforms often send push notifications the moment an error appears, allowing rapid response even when you are away from home.
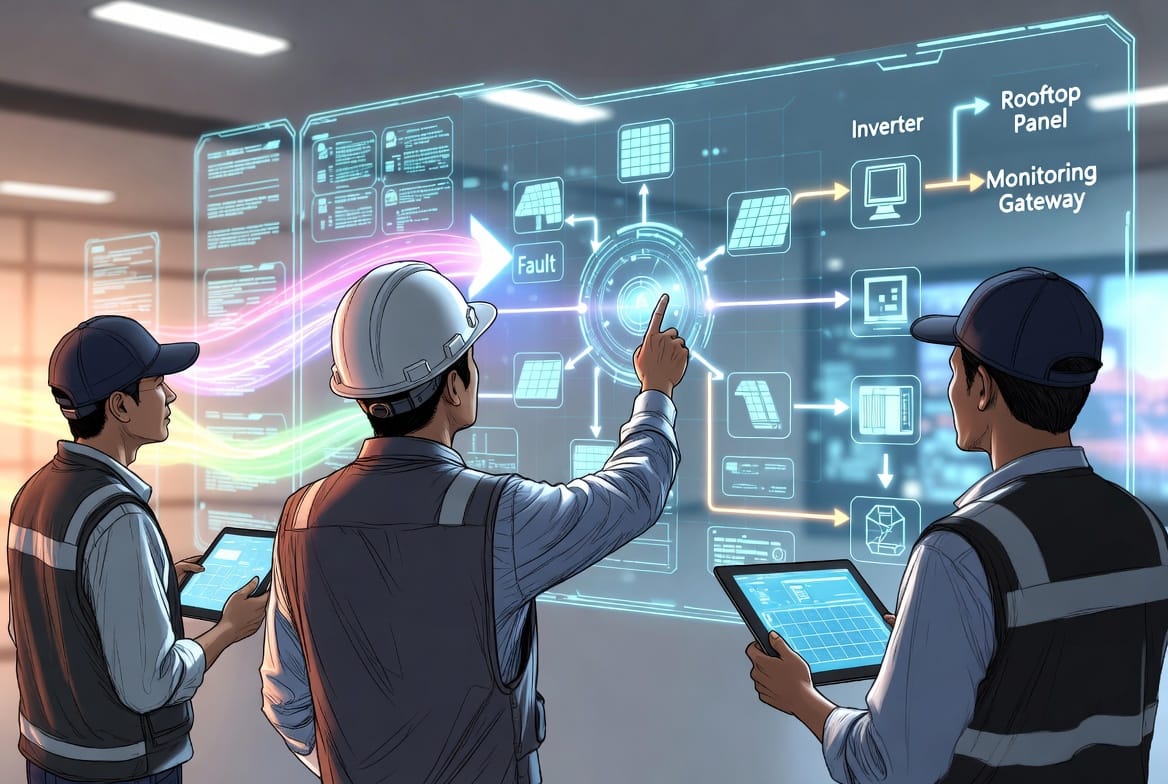
How to Spot Performance Drops
Recognizing underperformance early is one of the greatest benefits of regular monitoring. Watch for these clear patterns:
- Sudden change: A sharp decline in daily production compared with the previous clear day, especially if weather conditions are similar.
- Zero production: No energy registered during daylight hours when the sky is bright.
- Gradual decline: Daily averages slowly trending downward over weeks without an obvious seasonal explanation.
- Inconsistent string output: If your system reports production by individual strings or optimizers, one string lagging behind the others often points to a localized issue such as shading or a loose connector.
When any of these patterns appear, begin with simple checks: confirm the inverter is powered, inspect visible wiring and breakers, and note any recent weather events or nearby construction. If the data remains abnormal after these steps, contact your installer or a qualified service provider. Most performance issues are straightforward once the data has highlighted them.
Practical Daily and Weekly Habits
Building a light monitoring routine takes only minutes:
- Open the app or portal each morning and glance at current output and overnight error logs.
- Once a week, compare the past seven days of production against the same period last year or against expected weather-adjusted values.
- Monthly, review the lifetime total and any accumulated fault history.
- After storms or heavy pollen seasons, check for sudden drops that might indicate debris accumulation.
These habits keep you informed without becoming burdensome. Over time the numbers become familiar, and deviations stand out immediately.
Interpreting Data in Context
Numbers alone can mislead if context is ignored. A low daily total on a heavily overcast day is normal. Likewise, production will be lower in winter months at higher latitudes. Many monitoring platforms now include weather overlays or expected-production estimates that adjust for local conditions, making comparisons more accurate.
If your system includes battery storage, additional metrics such as state of charge and discharge cycles appear. Treat these the same way: learn the normal range, watch for outliers, and act when something falls outside that range.
Common Questions Homeowners Ask
How often should I check the data?
A quick daily glance and a deeper weekly review are ideal. Many people simply open the app while having morning coffee.
What if the app shows different numbers from the inverter display?
Slight differences can occur because of communication lag. If the discrepancy is large or persistent, note both readings and contact support.
Can monitoring help with warranties?
Yes. Documented production history and timely reporting of error codes strengthen warranty claims and demonstrate proper system care.
Is professional monitoring worth considering?
For larger systems or owners who travel frequently, a service that watches the data on your behalf and alerts you only when action is needed can be a valuable convenience.
The Reassuring Reality of Modern Systems
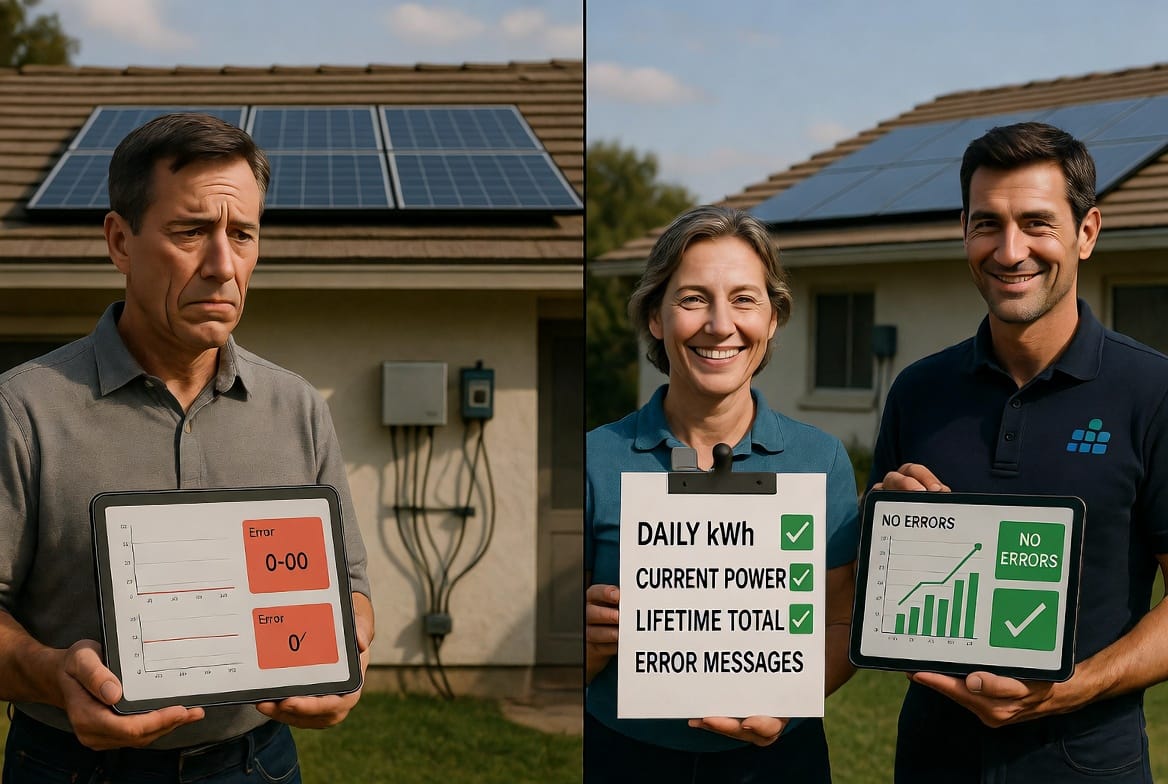
Today’s inverters and monitoring platforms are designed for reliability and transparency. Most issues that appear in the data are minor and quickly resolved. The very existence of clear, accessible information means you are never left guessing about your system’s health. By learning the handful of key metrics—daily production, current output, lifetime production, and error codes—you gain the ability to protect performance, optimize savings, and enjoy the full benefit of clean energy for years to come.
Regular monitoring is not about constant vigilance; it is about informed confidence. A few minutes of attention each week keeps small problems small and ensures your solar investment continues to deliver exactly what it was designed to deliver.
Taking the Next Step
You now have a clear framework for reading your inverter’s data. Apply it consistently and you will notice how quickly the numbers become second nature. Should any reading raise questions, or if you would like a professional review of your current monitoring setup, help is readily available.
Understand Your Solar Data Better – Speak to Our Team