The Solar Panel Data Monitoring: Understanding Your Production Reports
Owning a solar energy system represents a powerful step toward energy independence and long-term savings. Yet the true value of that investment becomes fully visible only when you know how to read the numbers your system generates every day. Solar panel data monitoring transforms raw performance figures into actionable knowledge, allowing you to confirm that your array is delivering the clean power you expect. This comprehensive guide walks you through every essential element of production reports so you can interpret results with confidence, identify concerns early, and keep your system operating at peak efficiency for decades.
Call Now to Optimize Your Solar Panel Performance
Modern monitoring platforms deliver continuous streams of information from your panels, inverters, and meters. Learning to interpret those streams removes uncertainty and replaces it with reassurance. Whether you check reports on a smartphone app or a desktop portal, the same core principles apply. By the end of this article you will understand exactly which metrics matter most, how to spot potential issues before they grow, and why consistent review of production data is one of the simplest ways to protect your solar investment.
Why Solar Production Reports Matter
Every solar installation is designed to convert sunlight into usable electricity. Production reports quantify that conversion in precise, measurable terms. Without regular review, small declines in output can go unnoticed for months, quietly reducing the financial and environmental returns you anticipated. Authoritative monitoring practices give homeowners and facility managers the ability to verify that the system is meeting projected yields, to document performance for warranty claims, and to demonstrate the tangible benefits of renewable energy.
Reliable data also supports smarter decision-making. When you understand daily and lifetime totals, you can plan energy usage more effectively, decide whether battery storage would add value, and communicate clearly with service technicians if adjustments are needed. In short, production report literacy turns passive ownership into active stewardship of a high-performing asset.
Core Metrics That Define System Health
Successful interpretation begins with a firm grasp of the primary figures that appear on nearly every monitoring dashboard. These metrics form the foundation of every production report and provide an immediate snapshot of system status.
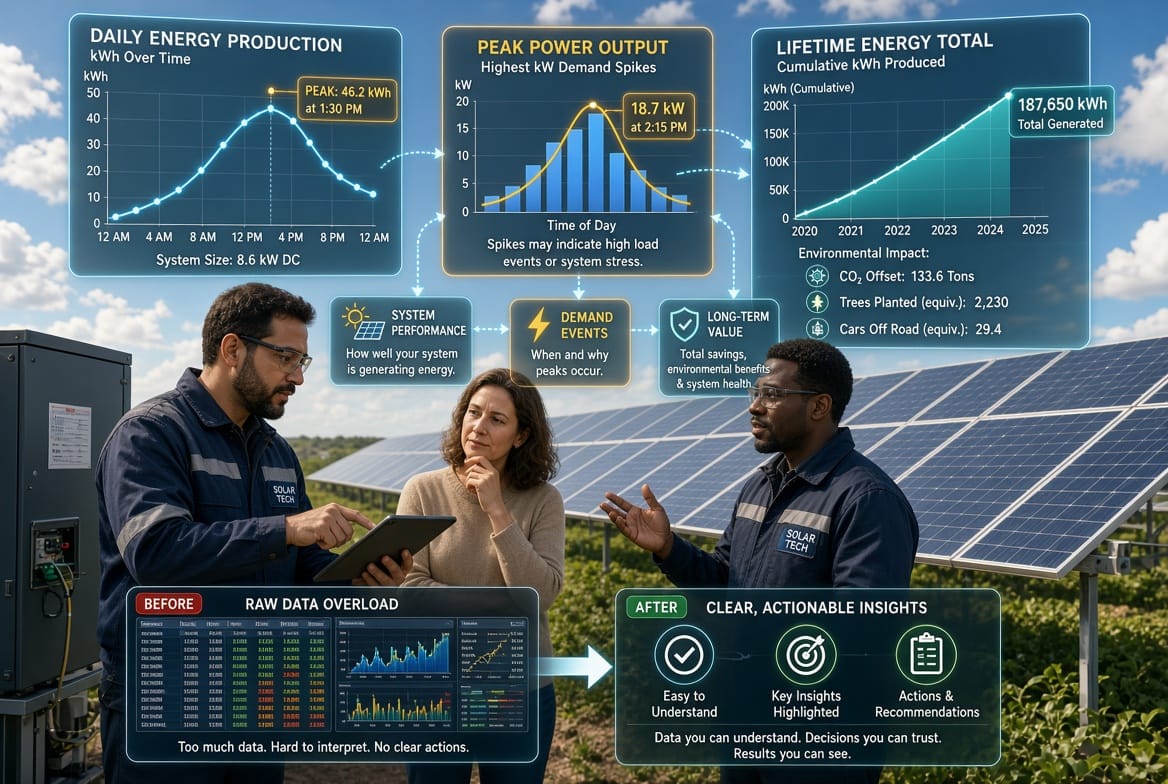
- Daily production (kWh) measures the total kilowatt-hours of electricity generated from sunrise to sunset on a given day. This number fluctuates with weather, season, and panel orientation, yet consistent tracking reveals normal patterns for your specific location.
- Peak output (kW) records the highest instantaneous power level achieved during the day, usually around solar noon under clear skies. Comparing peak values across similar weather days helps confirm that individual panels and the inverter are operating within expected ranges.
- Lifetime total accumulates every kilowatt-hour produced since the system was commissioned. This cumulative figure offers the clearest long-term view of overall contribution and is invaluable for calculating return on investment and environmental impact.
- Additional supporting figures such as specific yield (kWh per installed kW), performance ratio, and ambient temperature readings supply useful context but remain secondary to the three core metrics listed above.
Mastering these numbers allows you to move beyond simple observation and begin genuine analysis.
Interpreting Daily Production Figures
Daily production expressed in kilowatt-hours is the metric most homeowners check first. A typical residential system might generate between 15 and 40 kWh on a sunny summer day, depending on array size and geographic location. Winter days naturally produce less, often dropping to 5–15 kWh. The key is consistency relative to historical averages for the same month and similar weather conditions.
When reviewing daily kWh values, look for gradual seasonal trends rather than day-to-day volatility. A sudden multi-day drop that cannot be explained by cloud cover or snow cover warrants closer inspection. Many platforms display a percentage comparison against expected production based on weather models; staying within 10–15 percent of the forecast is generally considered healthy. Persistent under-performance relative to the model can indicate shading from new vegetation, soiling on panel surfaces, or early signs of equipment wear.
Recording daily totals in a simple spreadsheet or relying on the platform’s built-in charts creates a visual baseline. Over weeks and months this baseline becomes a powerful reference that makes anomalies stand out immediately.
Understanding Peak Output and Its Significance
Peak output, measured in kilowatts, captures the system’s maximum power delivery at any single moment. For a 10 kW array, a healthy peak under ideal conditions should approach or slightly exceed 9–10 kW, accounting for normal system losses. Lower peaks on otherwise clear days may point to inverter clipping, partial shading, or module mismatch.
Because peak readings occur only briefly, they are best evaluated alongside the corresponding irradiance data if available. A high irradiance reading paired with a low peak output is a clear signal that further investigation is needed. Monitoring platforms often flag these events automatically, yet manual review remains valuable for confirming that alerts are accurate and for understanding the underlying cause.
Tracking peak values across seasons also reveals how temperature affects performance. High ambient temperatures can reduce peak output even under strong sunlight; recognizing this normal behavior prevents unnecessary concern.
Lifetime Total: The Long-Term Performance Scorecard
The lifetime total is the single most reassuring number on any production report. It represents the cumulative clean energy your system has delivered since the first day of operation. Watching this figure climb steadily provides tangible proof of the system’s contribution to both household savings and carbon reduction.
Because lifetime totals grow continuously, they smooth out daily and seasonal variations. A system that has produced 50,000 kWh after five years of operation has demonstrably offset a substantial amount of grid electricity. Comparing the lifetime total against the original production estimate supplied at installation offers a straightforward performance audit. Most well-designed systems meet or exceed their projected lifetime yields when properly maintained.
Many owners find motivation in translating lifetime totals into real-world equivalents—miles driven on electric vehicles, trees planted, or households powered for a year. These translations reinforce the broader impact of the investment and encourage continued attention to monitoring.
Recognizing Warning Signs in the Data
Even the most reliable solar systems can experience temporary setbacks. The ability to spot issues quickly is one of the greatest advantages of diligent data monitoring. Two of the most common indicators are sudden production drops and inverter-related error codes.
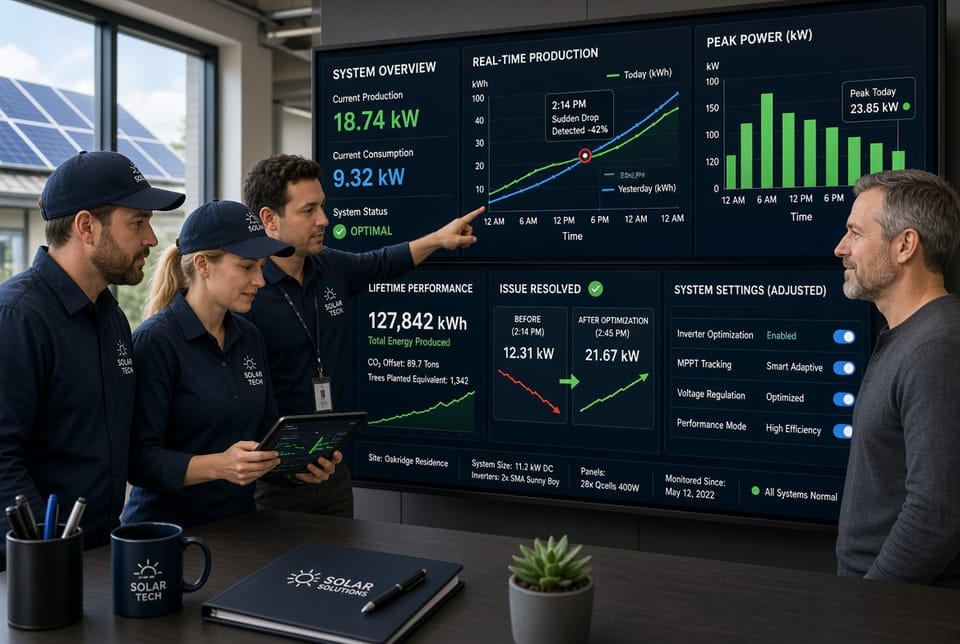
A sudden drop appears as an abrupt decline in daily kWh that cannot be attributed to weather. Possible causes include tripped circuit breakers, temporary shading from construction debris, or communication failures between the inverter and the monitoring portal. When a drop occurs, first verify that the physical system is free of obvious obstructions and that the main disconnect switch remains in the on position. If the drop persists beyond a single day, the monitoring data itself becomes the starting point for professional diagnosis.
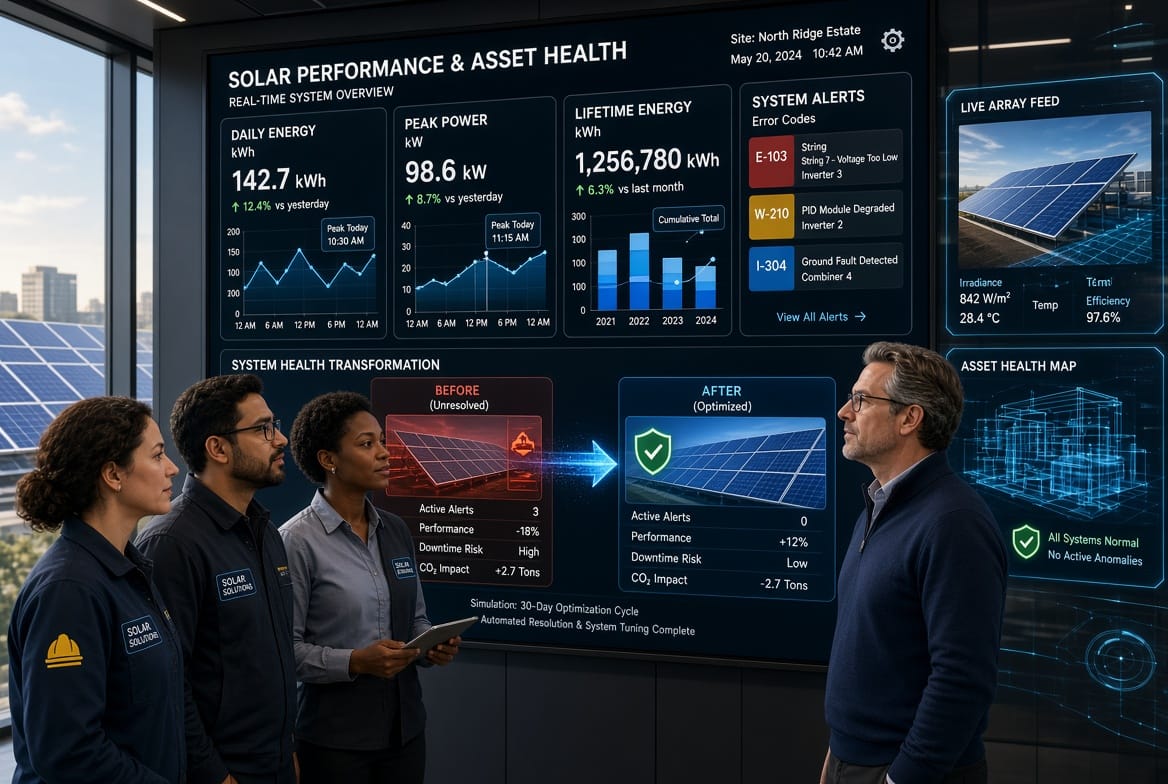
Inverter errors surface as specific codes or warning icons on the dashboard. Modern inverters are sophisticated devices that continuously self-diagnose. Common messages may reference ground faults, over-voltage conditions, or communication timeouts. Each code corresponds to a defined condition detailed in the manufacturer’s documentation. Rather than attempting complex repairs, the practical next step is to note the exact code and the time it first appeared, then share that information with a qualified technician. Early detection through monitoring often converts what could have been a multi-day outage into a brief service visit.
Additional subtle indicators include rising temperature differentials between modules, declining specific yield, and repeated partial power limitations. Consistent review of the full data set makes these patterns visible long before they significantly affect annual production.
Best Practices for Effective Monitoring
Establishing a simple routine maximizes the value of production reports. Many owners find that a weekly five-minute check is sufficient for residential systems, while commercial installations may benefit from daily automated alerts. Configure notifications for production falling below a chosen threshold or for any inverter fault so that issues reach you promptly.
Cross-reference your monitoring data with local weather records. Platforms that incorporate satellite or ground-station irradiance measurements provide the most accurate expected-versus-actual comparisons. When discrepancies appear, document them with screenshots and notes; this record becomes invaluable if warranty support is ever required.
Keep login credentials secure and update firmware whenever the manufacturer releases new versions. Updated software often improves data accuracy and adds useful analytical tools. Finally, share access with your installation partner or service provider so that professionals can assist remotely when needed. Collaborative monitoring accelerates problem resolution and maintains system uptime.
Turning Data into Long-Term Confidence
Interpreting solar production reports is not a technical chore reserved for engineers; it is a practical skill that any owner can master. Daily kWh values confirm that the sun is being converted into usable power. Peak kW readings verify that the hardware is capable of its design capacity. Lifetime totals celebrate the cumulative success of the investment. And the ability to recognize sudden drops or inverter errors ensures that minor concerns never become major setbacks.
With this knowledge you gain peace of mind that your solar array continues to perform as promised. Regular review of the data reinforces the decision to invest in renewable energy and positions you to extract maximum value for the full life of the system—often twenty-five years or more.
Monitor Your Solar Production Effectively
The insights contained in your production reports are among the most powerful tools available for protecting and optimizing a solar energy system. When those insights are reviewed regularly and understood thoroughly, the result is reliable performance, predictable savings, and lasting confidence.
If you would like personalized guidance on setting up or interpreting your monitoring platform, or if you simply want confirmation that your current data looks healthy, professional support is only a phone call away. Monitor your solar production effectively.
Spot Issues Fast – Call for Solar Production Support